
ete-evol
ete-evol is a tool that automates CodeML and Slr analyses by using pre-configured evolutionary models and directly producing a graphical representation of the results.
Highlighted features:
Pre-configured models include site (Yang et al. 2000; Massingham and Goldman 2005), branch (Yang and Nielsen 2002) branch-site (Zhang et al. 2005) and clade (Yang and Nielsen 2002; Bielawski and Yang 2004) models.
Multiple evolutionary models can be tested and visualized with a single command.
Input trees can be marked interactively using the ETE GUI
CodeML analyses can be fine tuned (use
--codeml_helpfor options)-
Multithreading options allow running multiple tests in parallel
Getting started
Evol-tree workflows
General concepts
-
To run a
ete3 evolworkflow we need a fasta file, a tree file and a model name. Also, if branch, or branch-site models are called, extra information should be passed in order to apply specific evolutionary constraints on sections of the tree. -
"Model names" correspond to several predefined evolutionary models that were based on previously published research (see table in next section, and PAML and Slr documentations).
-
Any of these predefined models can be modified easily with the command line, for example
--codeml_param getSE,1. -
Once run, the models can be compared with likelihood-ratio test (LRT). This can be done either automatically (default), or using pre-defined comparisons (
--testsoption).
Evolutionary models
Several predefined evolutionary models can be called with the tool.
They can be passed sequentially, and run in parallel:
ete3 evol -t ECP_EDN_15.nw --alg ECP_EDN_15.fasta -o results1/ --models fb M2 SLR --cpu 3
Available predefined models are:
| Model | Description | type | Citation |
|---|---|---|---|
| M0 | negative-selection | null | Ziheng Yang (2000) |
| M1 | relaxation | site | |
| M2 | positive-selection | ||
| M3 | discrete | ||
| M4 | frequencies | ||
| M5 | gamma | ||
| M6 | 2 gamma | ||
| M7 | relaxation | ||
| M8 | positive-selection | ||
| M8a | relaxation | ||
| M9 | beta and gamma | ||
| M10 | beta and gamma + 1 | ||
| M11 | beta and normal > 1 | ||
| M12 | 0 and 2 normal > 2 | ||
| M13 | 3 normal > 0 | ||
| SLR | positive/negative selection | Tim Massingham (2005) | |
| bsA | positive-selection | branch-site | Jianzhi Zhang (2005) |
| bsA1 | relaxation | ||
| bsB | positive-selection | Ziheng Yang (2002) | |
| bsC | different-ratios | ||
| bsD | different-ratios | Ziheng Yang (2002) Joseph P. Bielawski (2004) | |
| b_free | positive-selection | branch | Ziheng Yang (2002) |
| b_neut | relaxation | ||
| fb | free-ratios | ||
| fb_anc | free-ratios | branch_ancestor |
After a short time (2-5 minutes), CodeML/Slr input and output files should appear in the
results/ folder, including (if graphics capabilities were
available in your system) an image of your tree and the used alignment (Figure 2).
Marking trees
One of the main difficulty with automatizing CodeML for several trees
is to mark branches specifically for each model to run. ete3 evol allows to
pass lists of marks to be applied on each wanted branch model.
The tree can be marked with the command line like this:
ete3 evol -t ECP_EDN_15.nw --alg ECP_EDN_15.fasta --models b_neut b_free --mark Papio_EDN,,,Orang_EDN -o results2/
The three comas mean that the tree will be marked from the common ancestor of the surrounding species. To mark at the ancestral node we would have to put only two comas.
This coma-code allows to mark easily any part of the tree, using single coma new
marks are created. Finally spaces between parameters under --marks
separate sets of marks. Each branch model will be run on each set of marks. For example:
ete3 evol -t ECP_EDN_15.nw --alg ECP_EDN_15.fasta --models b_neut b_free --mark Human_EDN,,,Hylobates_EDN,Macaq_EDN,,,Papio_EDN Macaq_ECP,,Macaq2_ECP,Human_ECP,,Goril_ECP -o results3/
this, will in the first place, mark the tree as in Figure 3, and in second place as in Figure 4.
When, as in the example above, consecutive marks are passed, the given models ("b_neut" and "b_free" in this case) will be run independently for each group of marks.
Extra features:
-
In order to run a branch model for each branch of the tree, or for each internal node,
two (-non-exclusive) options are available:
--leavesand--internals. Note that these options are dangerous in the sense that may be subjected to the statistical problem of multiple testing. -
Alternatively marks can also be done interactively, using the GUI. With the option
--interactive, the GUI will pop up (Figure 3 and 4) and internal node will be mark with single left click.
Results exploration
By default ete3 evol will display the result of site models with histograms
(above and bellow the alignments), and the result of the free-branch model on the tree
changing its branch-lengths and showing the omega value as colored disks on the nodes
(Figure 2).
This image is saved as pdf in the output directory unless the --noimg is
used. The option --view allows to view this image in the ETE GUI and
interact with it. The GUI allows to browse all run models and compare
the different estimates of evolutionary rates. Finally new models can also be
run directly from the GUI (see the GUI section).
ete3 evol -t ECP_EDN_15.nw --alg ECP_EDN_15.fasta --models b_neut b_free --mark Papio_EDN,,,Orang_EDN -o results3/
Testing evolutionary models
In order to compare which of the different models computed fits better to the
input data, the ete3 evol tool tests, with a LRT, any pairs of computed models.
By default it will do the most classical comparisons, as the ones included in
the table bellow.
| Alternative | Null | Test |
|---|---|---|
| M2 | M1 | PS on sites (M2 prone to miss some sites) (Ziheng Yang (2000)) |
| M3 | M0 | test of variability among sites |
| M8 | M7 | PS on sites (Ziheng Yang (2000)) |
| M8 | M8a | RX on sites |
| bsA | bsA1 | PS on sites on specific branch (Jianzhi Zhang (2005)) |
| bsA | M1 | RX on sites on specific branch (Jianzhi Zhang (2005)) |
| bsC | M1 | different omegas on clades branches sites (Ziheng Yang (2002)) |
| bsD | M3 | different omegas on clades branches sites (Ziheng Yang (2002), Joseph P. Bielawski (2004)) |
| b_free | b_neut | foreground branch not neutral (w != 1) - RX if P<0.05 (means that w on frg=1) - PS if P>0.05 and wfrg>1 - CN if P>0.05 and wfrg>1 (Ziheng Yang (2002)) |
| b_free | M0 | different ratio on branches (Ziheng Yang (2002)) |
Specific tests can also be calculated using the --tests flag. For example:
ete3 evol -t ECP_EDN_15.nw --alg ECP_EDN_15.fasta --models M2 M1 b_free b_neut --leaves --tests b_free,b_neut -o results4/
Will give this result, with only the tests computed between branch models, not sites even if computed:
  LRT

      Null model |        Alternative model | p-value
      ------------------------------------------------------------
      b_neut.2 |                 b_free.2 | 0.273900
      b_neut.7 |                 b_free.7 | 0.487915
      b_neut.9 |                 b_free.9 | 0.273900
      b_neut.8 |                 b_free.8 | 0.047845*
      b_neut.3 |                 b_free.3 | 0.487915
      b_neut.1 |                 b_free.1 | 0.487915
      b_neut.5 |                 b_free.5 | 0.487915
      b_neut.6 |                 b_free.6 | 0.273900
      b_neut.4 |                 b_free.4 | 0.273900
      b_neut.13 |                b_free.13 | 0.088539
      b_neut.12 |                b_free.12 | 0.487915
      b_neut.15 |                b_free.15 | 1.000000
      b_neut.14 |                b_free.14 | 1.000000
      b_neut.11 |                b_free.11 | 0.109049
      b_neut.10 |                b_free.10 | 0.487915
Notes:
-
Numbers appearing after model names correspond to the PAML node IDs, a table
of correspondence with input species name can be viewed using the option
--node_ids. - In this case only one branch was fitting significantly better with a free ratio model, however the number of tests done being quite large, one could start thinking of applying a correction for multiple testing.
Using the GUI to run models and explore results
As previously mentioned ETE GUI's possibilities goes beyond the visualization of results, and allows to run "on the fly" any default evolutionary model (see Evolutionary models).
See Figure 5 for an example on how to mark a branch and run a model using the GUI.
Advanced options
--clear_all: Clear any data present in the output directory.--prev_models: directory where pre-calculated models are stored, followed by coma model-name. example: --prev_models /path1/,M2 /path2/,M1 will load models from path1 under the name 'M2', and from path2 into 'M1'--clean_layoutOther visualization option, with omega values, synonymous rates and non-synonymous rates written on branches--histface: Type of histogram face to be used for site models. If preceded by '+-' error bars are also drawn (can be bar, stick or curve).--codeml_paramextra parameter to be interpreted by CodeML and modify the default settings of models. available keywords are accepted [default values]:[ 0] aaDist [ 0.0] alpha [ 0] cleandata [ 0] clock [ 2] CodonFreq [ 1] fix_alpha [ 0] fix_blength [ 0] fix_kappa [ 0] fix_omega [ 0] getSE [ 0] icode [ 2] kappa [ 0] Malpha [ 0] method [ 0] Mgene [ 0] model [ 8] ncatG [ *10] ndata [ 0] noisy [ 2] NSsites [ 0.7] omega [ out] outfile [ 0] RateAncestor [ 0] runmode [algn] seqfile [ 1] seqtype [1e-6] Small_Diff [tree] treefile [ 2] verboseexample: verbose,2 omega,1--codeml_helpshow detailed description on codeml parameters for model configuration and exit.--cpu: Maximum number of CPU cores available in the execution host. If higher than 1, tasks with multi-threading capabilities will enabled (if 0 all available) cores will be used.--codeml_binary: path to CodeML binary.--slr_binary: path to Slr binary.
The following files are used in the examples on the left
This dataset is from a previously published work (Joseph P. Bielawski (2004)) where it was used as an example of differential selective pressure in the paralogous genes ECP and EDN in primates (Figure 1).
Extended documentation
This page shows the basic usage of ete-evol. More options and examples are available as a collection of notebooks.
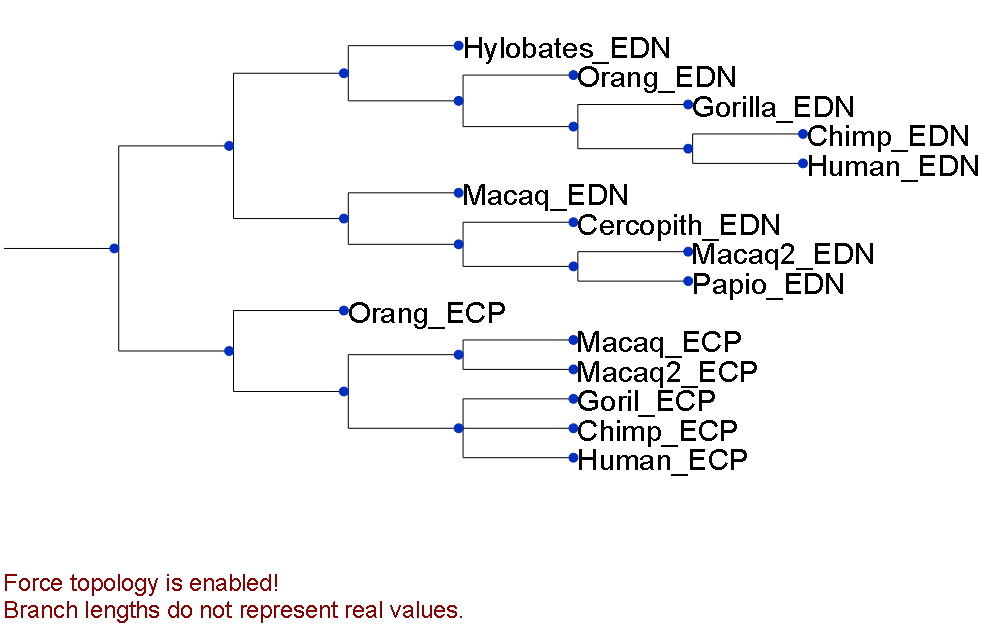
Fig 1. GUI in interactive marking "mode" with one branch marked.
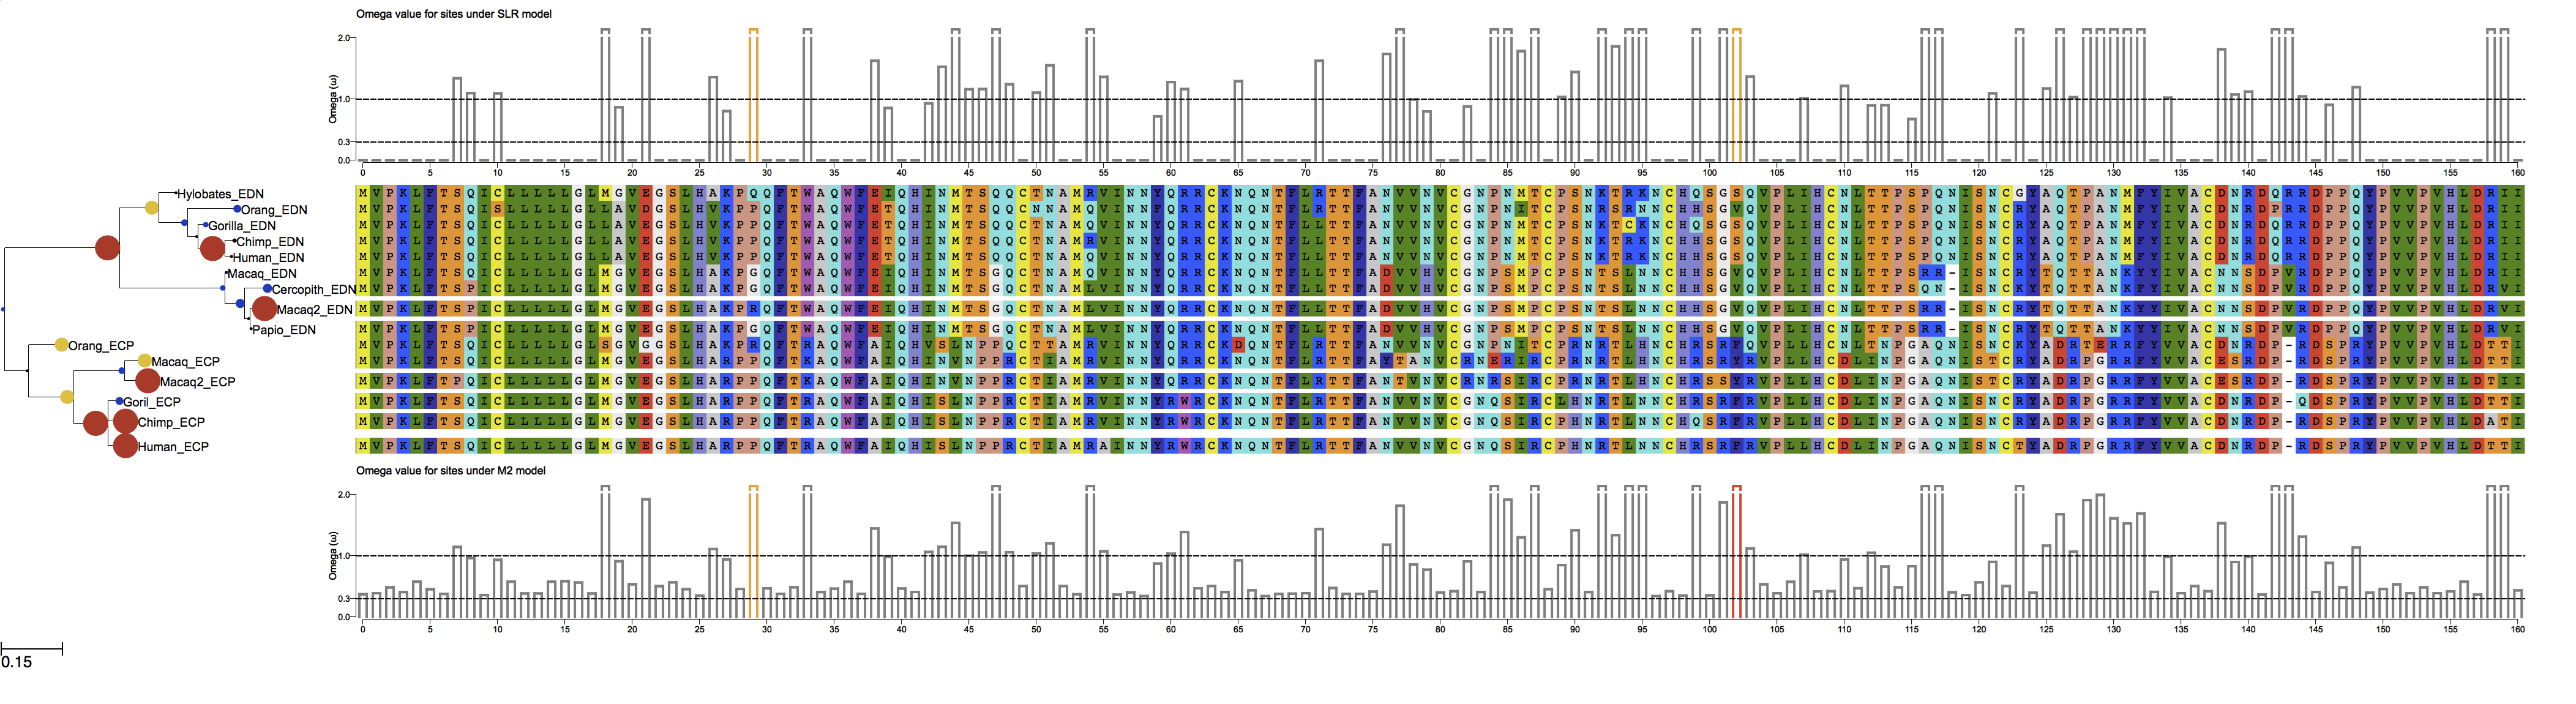
Fig 2. Default view of the example with loaded models "M2", "SLR" and "fb".( Note, that omega values are represented in the node sizes and colors. Small blue disks for low omega values, to large red disks for large omega.
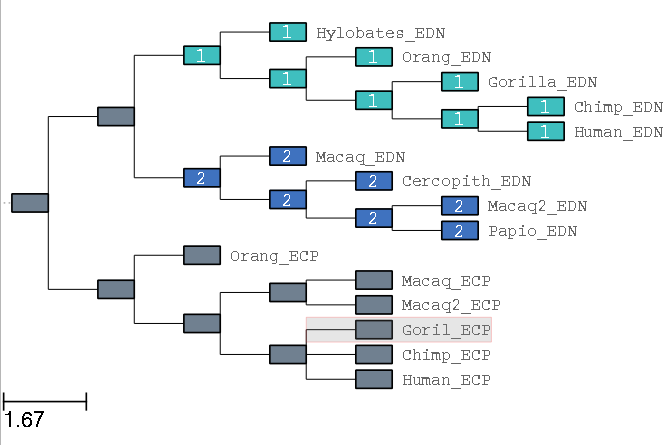
Fig 3. View of marks on two groups of branches (image corresponding to the GUI in
interactive marking "mode", available with the --interactive).
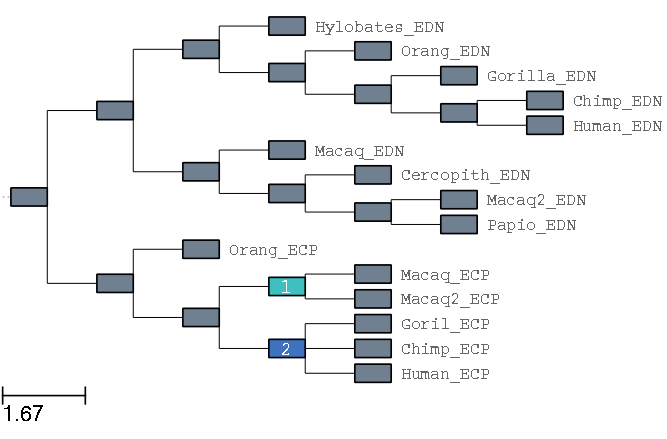
Fig 4. View of marks on two ancestral nodes (image corresponding to the GUI in
interactive marking "mode", available with the --interactive).

Fig 5. Default view of the example with loaded models "M2", "SLR" and "fb". Numbered arrows are marking the steps to follow to interactively run a branch-site model: 1- Mark a branch of the phylogeny, 2- select the model to run, and 3- click on the "Run" button.